If you frequent investor websites, message boards, or pretty much anywhere on the internet, you’ve undoubtedly seen numerous ads tipping you off to stocks that are ready to EXPLODE with gains of 50%, 500%, or even 5,000%! Well 50,000% of the time, these advertisements are just pump-and-dump schemes ready to take your money instead. But is there really a way to mathematically measure the ‘explosiveness’ of a stock you may own, or want to own? In this post I’ll present you with a relatively simple technical indicator that can give you insight into the explosiveness of a stock. You don’t need a massive database of market info or a strong background in computer programming to implement this one. A visit to a website with historical data like Yahoo! and a working knowledge of Excel will do just fine.
The first question we need to ask is, ‘How much ground (price) has a stock covered in a certain day?’ The answer to this question tells how volatile the stock is, an important indicator of its potential to increase or decrease in price. The simplest measure of this is the difference between the high and the low prices for the day, divided by the open.
(Phigh – Plow) / Popen
Unfortunately, this only tells us the percent range the stock has oscillated between throughout the day, not the actual price range it has covered. A better assumption uses the idea that stock prices follow a random walk (to a good approximation). Sparing you the gory details (read: Gaussian random walk), a better estimate of price range a stock has traveled within a day is
STDprice * sqrt(Volume).
The second term is just the square root of the volume for that day, and comes from the root-mean-square of random walk steps. The first term, STDprice , is the standard deviation of the price for the day, assuming a Gaussian distribution of prices. If we assume the price highs and lows for the day are 2 standard deviations away from the mean (for those worried about this assumption, it will just add an arbitrary scaling factor to the
measure, which has no effect), then our new equation becomes…
STDprice * sqrt(Volume) = (Phigh – Plow) * sqrt(Volume) / 4*Popen
We are almost there. If this equation gives us a good estimation of the price range a certain stock has traveled through in a day, then all we need to do is divide this by the volume of shares traded. Multiplying this by 100 gives us the percent change in the stock price each traded share caused, or as I like to call it, the
Share Strength Indicator (SSI).
SSI = 100* (Phigh – Plow) / (4*sqrt(Volume) Popen)
What this tells us is how much of an effect buying or selling a single share will have on the stock price. Let’s look at some examples and see how it works.
______________________________________________
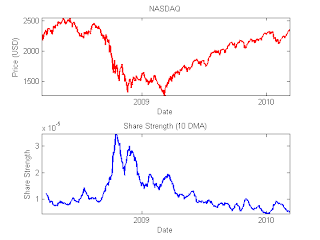
We see, both with STEC’s epic 1 year run, and AVNR’s up and down rise, that the SSI (bottom, blue) did a nice job indicating the stock price’s (top, red) ability to move. Just before STEC’s run (early 2009) a trade of only 1000 shares (<$10,000) could move the stock 3%. This was a marked sign of illiquidity, and preceded massive gains in price.
So I’ve given you the golden indicator that will make you all millions, right? Umm… not quite. Keep in mind that this is a measure of volatility-per-share, or how much it will go up or down, not IF it will go up or down.
Here’s a case in point with DRYS. Notice how SSI took a nice little jump just before the epic fall in price and epic rise in SSI; the measure works both ways. Look below; it even identified some of the rises and falls of the great recession.
So how can you use this to make yourself money? One obvious way is in options trading, with both a call and put option well outside of the money. One option will end up worthless but the other could increase N fold, always a good investment. Another potential application is when you are very confident a stock will go in a certain direction and you want to maximize profits. It also could be used nicely in combination with short data as well, maximizing the BANG of a short squeeze. In the end, use it how you see fit. It obviously doesn’t work 100% of the time, and the SSI can remain arbitrarily high for any length of time. But, used properly it can be a nice addition to your technical analysis toolbox.
Dr. Troy Lau
(On occasion, I’ll present a new technical indicator that anybody can use to track equities. Feel free to use them as you feel fit.)


For us that are ignorant to trading formulas and calculations do you mind giving a quick number calculation for example in AVNR break down the actual formula in numbers and how the numbers finally derived the SSI.
ReplyDeleteThanks
Hi Gary,
ReplyDeleteSure, no problem. Let's take a look at the last 5 days for AVNR.
Date Open High Low Close Volume
03/11/2011 4.05 4.10 3.89 4.03 2,554,295
03/10/2011 3.93 4.13 3.85 4.06 3,896,262
03/09/2011 3.56 4.02 3.54 4.01 8,884,308
03/08/2011 3.43 3.59 3.37 3.51 4,184,166
03/07/2011 3.52 3.52 3.35 3.43 3,238,879
If we want to calculate the SSI for 3/1/2011 we use the formula
SSI = 100* (Phigh – Plow) / (4*sqrt(Volume) Popen)
or
SSI = 100* (High - Low) / 4*sqrt(Volume)*open
or
SSI = 100*(4.10-3.89) / 4*sqrt(2,554,295)*4.05
= 21/(4*1598*4.05) = 21/25891 =.00081.
Which means for each share you trade you can move the stock .00081 percent, or it would take about 1234 shares to move the stock a single percent.
Hope this helps!
Troy
It does... Thank you
ReplyDelete